A practical guide to reading what happens in the front-end
Before we start
When a page doesn't behave the way you expect, the temptation is to change code at random until something falls back into place.
DevTools exist precisely to avoid working that way. They let you watch the browser as it interprets HTML, CSS, JavaScript, images, network requests and stored data.
This guide isn't trying to cover every panel in depth. The goal is to give you a simple routine for working out where to look when layout, scripts, images, API calls or performance go wrong.
1. The browser is not a black box
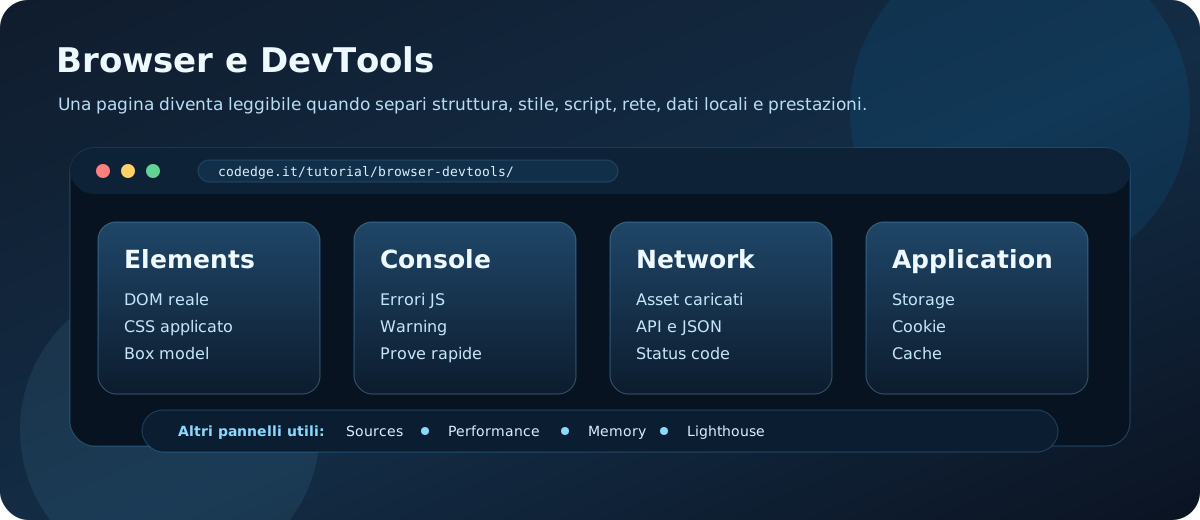
A web page isn't just the file you wrote. In the browser it becomes a living combination of DOM, computed CSS, executed JavaScript, loaded assets and session state.
That's why DevTools matter so much: they show the version the browser is actually using, not just the one you think you built in your project.
To begin with, knowing these panels well is enough:
- Elements: HTML structure, classes, attributes and applied CSS.
- Console: JavaScript errors, warnings and quick experiments.
- Sources: loaded files, breakpoints and step-by-step debugging.
- Network: loaded files, API requests, status codes and timings.
- Application: localStorage, sessionStorage, cookies, cache and service workers.
- Performance, Memory and Lighthouse: more targeted analysis of speed, memory and overall quality.
You don't need to open everything every time. You need to know which panel answers the question in your head.
2. Inspector: the real HTML and CSS
The Elements panel is the starting point when something looks wrong: spacing, color, alignment, fonts, sizes, hover states, missing classes.
The most important thing to understand is this: you aren't looking at the original HTML file, but at the DOM after the browser and JavaScript have built it.
Use it to answer very concrete questions:
- does the element actually exist on the page?
- does it have the class I expect?
- which CSS rule is winning?
- is a property struck through because it was overridden?
- does the box model explain the odd margins, padding or sizes?
A good habit: inspect the element first, then temporarily tweak CSS and classes in DevTools. Once you've worked out the fix, carry it back into the real file.
3. Console: errors and quick experiments
The Console is where the browser talks to you most directly. When JavaScript breaks, the first serious clue is usually there.
Don't just read it as "red = panic". Look at three things: the message, the file involved and the line number. Together they are already a small map.
You can also use it for quick experiments:
document.querySelector("h1")
document.querySelector(".button-simple")?.textContent
localStorage.getItem("theme")
These experiments don't replace your project code, but they help you check whether a selector is right, whether an element exists, or whether a value really was stored.
When an error looks cryptic
Start from the type of error, not from the fear it triggers.
- ReferenceError
- you are using a name JavaScript doesn't know at that point.
- TypeError
- you are performing an operation on a value of the wrong type — often
nullorundefined. - SyntaxError
- the code isn't written in a valid form: brackets, commas, quotes or structure.
4. Network: requests, assets and APIs
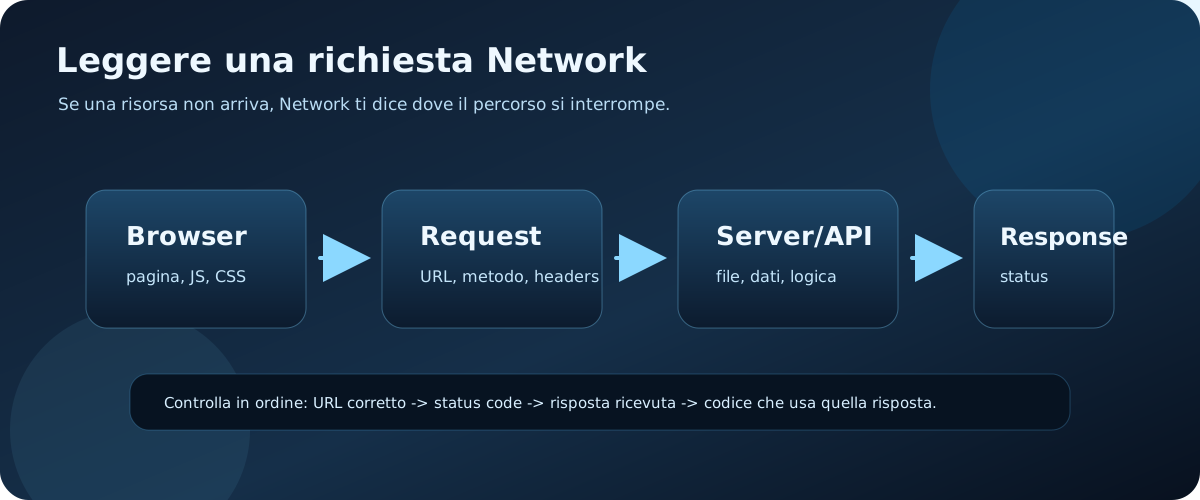
When images, CSS, scripts or data don't arrive, the Network panel is often more useful than the Console.
Here you can see every request the page makes: static files, fonts, images, fetches to APIs, JSON responses, redirects and failures.
There are only a few checks that really matter:
- Status:
200ok,404not found,500server error,403access denied. - Type: tells you whether it is a document, script, stylesheet, image, fetch or something else.
- Preview/Response: shows you what actually came back.
- Headers: useful for the URL, method, content type, caching and authorization.
If an API call "doesn't work", first check whether it is even being sent. Then look at the URL, the status code and the response. Only after that does going back to the code make sense.
5. Application: storage and cache
Some problems aren't in the code you just wrote, but in the state the browser is holding on to.
The Application panel helps you check:
localStorage: data that survives closing the browser;sessionStorage: data that lasts only for the current session;- cookies: often used for preferences, sessions and tracking;
- cache and service workers: they can serve stale files when misconfigured.
If a change seems to be ignored, try reloading without the cache, or check whether a service worker is still serving an earlier version.
6. Sources, Performance, Memory and Lighthouse
These panels are very useful, but they aren't always the first place to open. Think of them as targeted tools, for when your question is more precise.
- Sources
- lets you see the files the browser loaded, set breakpoints, pause JavaScript and follow the code step by step.
- Performance
- is what you want when a page feels slow: it records loading, rendering, heavy scripts, layout work and the moments the main thread is busy.
- Memory
- becomes useful when you suspect abnormal consumption, leaks, or objects lingering in memory long after they should be gone.
- Lighthouse
- runs a quick audit on performance, accessibility, best practices and SEO. It is a compass, not a final verdict.
To start well, the priority is still understanding Elements, Console and Network. These panels then help you level up when the problem is no longer just "it doesn't work" but "why is it slow", "where does it hang" or "what can I improve".
7. A minimum debugging routine
When something is broken, one simple routine is worth more than ten random attempts.
- Reproduce the problem with one precise step.
- Open the Console and check for errors or warnings.
- If it is a visual problem, inspect the element in Elements.
- If data or assets are missing, move to Network.
- If JavaScript is behaving oddly, use Sources with a breakpoint.
- If the page is slow, look at Performance or Lighthouse.
- If the problem seems "stuck in the past", check the cache, storage and service workers.
- Make one small change, verify it, then move on to the next.
This method doesn't magically make bugs easy, but it stops you mixing too many problems together.
A quick checklist
- is the page loading the right CSS?
- does the JS selector actually find the element?
- is the API request sent, and does it get a response?
- is the asset URL correct online too?
- does a breakpoint in Sources confirm the expected flow?
- is Lighthouse flagging real problems or just polish?
- is the cache showing an old version?
8. Where to go from here
DevTools become genuinely useful once you stop seeing them as a technical panel and start using them as a reading instrument.
Every time something doesn't add up, the browser already holds plenty of clues: the real HTML, computed CSS, errors, requests, timings, stored data, loaded files and metrics.
To consolidate the path, these guides fit together well:
- VS Code essentials: to connect debugging, terminal and local project.
- Deployment basics: to understand what changes once the page goes online.
- Git without panic: to save your progress and roll back when you need to.
- All tutorials: to follow the rest of the available content.
9. Quick reference (cheat sheet)
Here are the main diagnostic panels and when to use them:
| Panel | What it analyzes | Main use case |
|---|---|---|
| Elements | HTML structure (DOM) and active CSS styles. | Tweaking CSS colors or alignment in real time before writing the source code. |
| Console | Errors, warnings and JS execution. | Checking for blocking load errors or undefined variables. |
| Network | HTTP requests for all of the site's resources. | Spotting broken images (404 errors) or heavy resources slowing the page down. |
| Application | LocalStorage, SessionStorage, cookies. | Inspecting the data the site stores, or clearing session cookies to test login. |
10. Practical challenge: put yourself to the test
Put your inspection skills into practice using your favourite browser:
Do a visual debug by temporarily changing a CSS rule, then analyze the active network calls.
Step-by-step instructions:- Open the developer tools (
F12) on this page. - Turn on the element picker and highlight the guide's main heading.
- In the CSS styles side panel, add a temporary
color: red;rule and watch the style change on screen immediately. - Move to the *Network* panel, select the *Img* filter and reload the page (
F5) to check how every image on the page loads, along with its size.
11. Check what you have learned (quiz)
Test what you have learned in this guide with a quick 10-question multiple-choice quiz.